Things are going well. You're trying out the best new music marketing strategies, you feel upward momentum, pieces of the puzzle are falling into place, and your brand is finally getting some attention.
Three months go by, and your boss (or your own curious self) wonders, what is all this new content marketing doing for me? What are the tangible results?
Success is defined by the goals you set, and if you don't have SMART (specific, measurable, attainable, relevant, timely) goals established with accurate methods of evaluating your progress toward them, then what is that upward momentum, really? What if you're behind where you should be? What if you're ahead? Is it just nice outside? You don't know!
If you don't take time to analyze your marketing efforts, then you can never adapt your strategy accordingly.
And those that don't adapt, well, they fail.
Fortunately for us, many of the tools you can use to evaluate your marketing efforts are free and built into the platforms you utilize on a daily basis.
Let's take a brief look at the tools available and then create our own SMART goal using data from Twitter, Facebook, and Google Analytics.
Facebook:
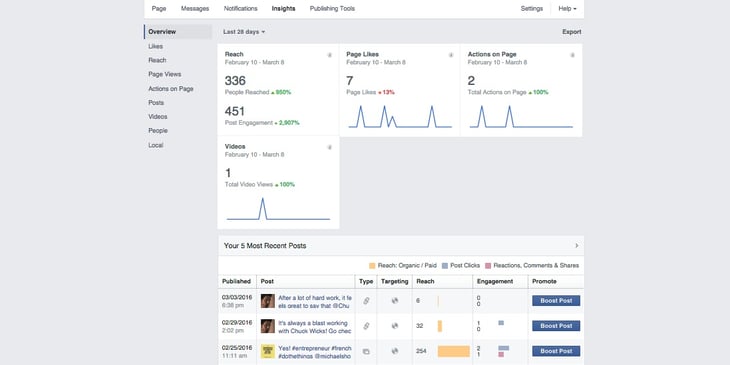
Facebook has robust analytics platform built straight into your business page. Simply go to your business profile and click on "Insights" above your cover photo.
This takes you to the Analytics dashboard.

There's a lot of information that's useful here! You can review a variety of metrics revolving around your page and posts. Anything from post reach, overall page reach, rough demographic information, and paid vs. organic impressions stats can be found here.
If you just said, "Ok... but what the heck do reach and impression mean?" Click here.
I recommend going back as far as possible while retaining relevance in order to calculate a good SMART goal. For some objectives that may be six months. For other, it could be 3 years!
Twitter:
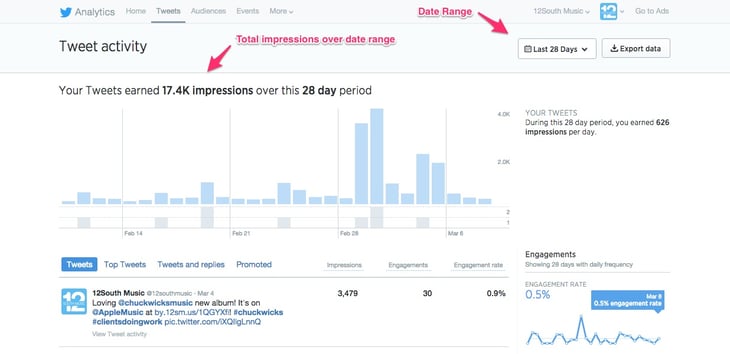
Twitter also has a solid reporting platform. While you're logged into your desired Twitter profile, head over to analytics.twitter.com to see stats on your profile.
 The language should feel fairly similar to Facebook's (reach, impressions, engagement rate) etc..
Your Website:
Google Analytics is a fantastic free tool that allows you to track a lot of information on user behavior, amount of visits, surface-level demographic information, and much. much more
It's easy to get overwhelmed by the sheer amount of data GA offers, but taking the time to do a bit of training goes a long way.
For a great source of Google Analytics walkthroughs, check out Lynda.com.
Head over to analytics.google.com to see your profile. The first thing you'll have to do (if it isn't set up already) is install your "Google tracking code"
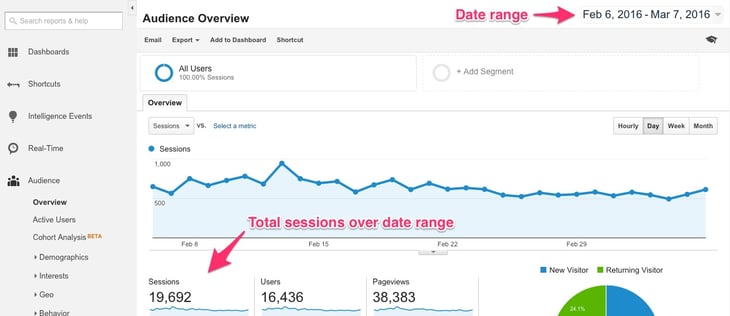
Once you enter the dashboard, it should look like this:

*Note: if you just installed the tracking code it will take time for data to populate. I'd wait at least a month before reviewing to gather enough data to make a conjecture.*
Sessions (the amount of times a user stayed on the site for a duration of time), Users (# of individuals), and Pageviews (number of pages views), are all useful surface-level metrics to observe on a regular basis.
Think SMART

O.K.! We've covered how to access three free analytics dashboards. Now let's make a SMART goal.
Let's say you're a merchandise company that primarily sells online.
The idea is to segment your online "marketing and sales funnels" to find the metrics that can illuminate a customer's step-by-step path toward your bottom line.
You have three main data points as an online company.
1. Impressions
A.k.a. people that see a piece of your content. This can be social impressions or ad impressions.
2. Website Visits or Sessions
Individuals that land on your website.
3. And of course, a sale through your online store.
You can review this information through whatever type of online store you run your sales through (Stripe, Paypal) etc..
Now, let's work backward to create an effective SMART goal

Say you wanted to increase your current yearly revenue of $100,000 by 10% within six months.
Step 1: Revenue
Ok. So we need to increase gross revenue by $10,000 in six months.
Say we currently have 1000 orders a month averaging around $100 an order (found through your store's reports. E.g. You could export all orders over the past year and divide that by your gross revenue to reach average cost per order).
Using this as a base, we can estimate that we need an additional 100 customers within six months to reach our goal.
Step 2: Website Visits
Let's say our site brought in 100,000 visits per month over the last year, giving us a website conversion rate of 1% (100,000 visits/ 1,000 customers)
This means we need to increase our visits by 10,000 over six months.
Let's also say that 20,000 of those monthly visits come through social channels (found through Google Analytics).
Step 3: Reach
Say our current social reach between Twitter and Facebook is 1,000,000 (found via the Twitter and Facebook platforms outlined above!) , which gives us a 0.02% impression to visit conversion rate.
So: we need to increase our social reach by 500,000 by the end of six months to reach our goal.
Step 4: Establish overall and month by month goals
Now we can establish our SMART goal for six months and month by month!
Six month goal: Increase social reach by 500,000, website visits by 10,000, purchases by 100, and revenue of our merchandise company's online sales by 10% by the end of six months.
Month to month: Increase reach by 83,333, website visits by 1,667, purchase by ~17, and revenue by 1.67%.
And there you have it! By using the above goal method and analytical tools, you can accurately track your progress toward your goals by checking on these numbers monthly.
Now you can establish an actual ROI on your digital marketing investments.
One last thing — obviously we only highlighted two social platforms. Each business's platforms of choice and sources for reach can be different. It could be email, word-of-mouth, PR, local advertising — you name it. The idea is to segment your online "marketing and sales funnels" to find the metrics that can illuminate a customer's step-by-step path toward your bottom line.
Once you collect all the metrics, work backward from your revenue goal to find out how much each metric needs to increase. This also helps determine how much to spend on marketing!
It takes time, but believe me, it's worth it.
Cheers.


